
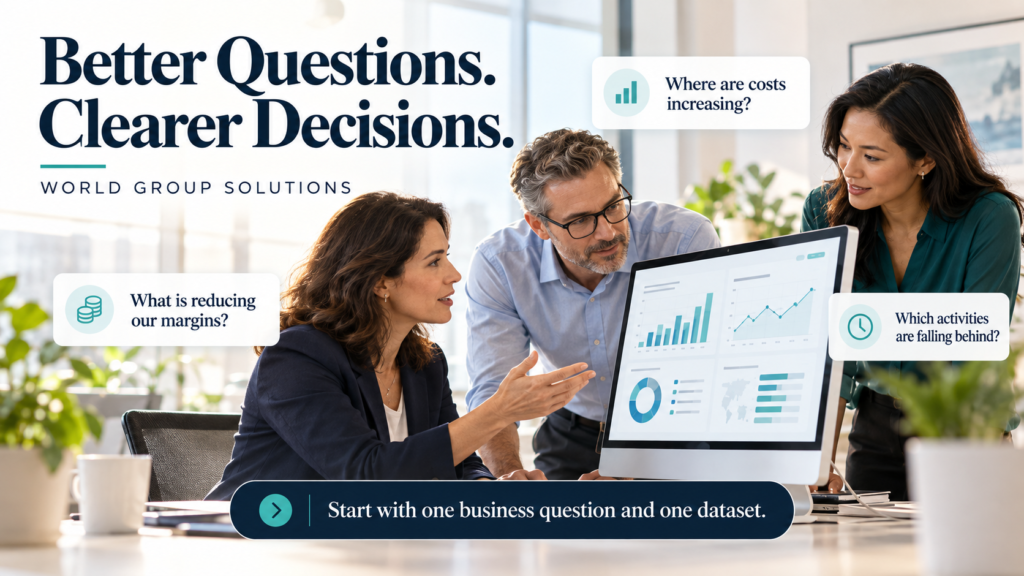
A useful dashboard starts with the questions your business needs answered.
At World Group Solutions, we combine SI-assisted analysis with human business judgment to turn your data into dashboards that support decisions. Whether the question comes from your operations head, finance team, or CEO, we focus on what matters: understanding performance, identifying problems, and deciding where to act.
Our approach is simple:
-
Tell us what you want to solve.
Where are costs increasing? What is reducing margins? Which activities are falling behind? We start with your priorities. -
Share the data available to you.
Begin with a sample dataset, a completed template, or actual business records. We review whether the data can answer your questions and identify any gaps. -
See your questions take shape as answers.
We use carefully designed prompts, analytical methods, and business review to translate your requirements into meaningful measures, visual comparisons, and findings supported by your data. -
Review your first dashboard—then refine it together.
You do not need to define every detail upfront. Once you can see the first dashboard, you can tell us what is useful, what needs changing, and which questions to explore next.
Start with one business question and one dataset. Let us build the first dashboard around the decisions you need to make.
1. Traditional reporting is backward-looking
Most companies already have reports. They answer questions like:
-
What were last quarter’s sales?
-
What was the margin?
-
What regions underperformed?
That’s post-mortem analysis.
AI-powered data insight shifts the focus forward:
-
What’s about to go wrong?
-
Which metric is becoming risky before it explodes?
-
Which decision we made last month is quietly hurting margins now?
👉 Executives don’t need more charts. They need early warning systems.
2. AI finds patterns humans miss
Humans analyze data linearly. AI doesn’t.
AI can:
-
Detect weak signals across millions of rows
-
Correlate variables you wouldn’t think to connect
-
Spot anomalies that look “normal” in isolation
Example:
Margin erosion isn’t coming from pricing — it’s coming from a specific customer segment + discount timing + supply delays.
No human team catches that fast enough.
3. From dashboards to decision engines
Classic BI dashboards:
-
Show KPIs
-
Require interpretation
-
Depend on analysts to explain them
AI insight systems:
-
Explain why a KPI changed
-
Simulate what happens if nothing changes
-
Recommend specific corrective actions
Think:
“If you don’t adjust supplier mix in the next 60 days, margin drops another 2.3%.”
That’s decision support, not reporting.
4. Executives can ask real questions — in plain English
With AI layered on data:
-
CEOs don’t need SQL
-
CFOs don’t wait for analysts
-
CIOs don’t babysit reports
They can ask:
-
Where is money leaking right now?
-
Which decision we made recently is hurting us?
-
What risk looks small today but becomes a big loss in 6 months?
-
Where are we over-investing with no measurable return?
AI translates the question → interrogates the data → explains the answer.
5. Faster decisions, lower dependency, lower cost
Without AI:
-
Analysts build reports
-
Meetings interpret them
-
Decisions lag by weeks
With AI insight:
-
Questions → answers in minutes
-
Fewer back-and-forth cycles
-
Less dependency on scarce (and expensive) talent
That’s operational leverage.
6. Competitive advantage compounds over time
Companies using AI insight:
-
React faster
-
Predict better
-
Allocate capital smarter
Companies not using it:
-
Discover problems after damage is done
-
Justify decisions instead of validating them
-
Lose quietly, quarter by quarter