Florist

Florist

Key Performance Indicator (KPI) for Florist

To name a few:

Sales & Revenue KPIs

  • Total Revenue: Overall sales generated during a certain period (daily, weekly, etc.). This is your top-line metric.
  • Sales Growth: Increase (or decrease) in revenue over time.
  • Average Order Value (AOV): Average amount spent per customer order. Increasing this drives revenue.
  • Sales by Product Category: Track sales for bouquets, arrangements, plants, gift items, etc. This helps adjust inventory and promotions.
  • Foot Traffic (for physical locations): Number of customers entering the store. Shows your potential customer reach.

Customer-Focused KPIs

  • Customer Satisfaction Surveys (CSAT): Measure satisfaction with flower quality, arrangement design, service, etc.
  • Net Promoter Score (NPS): Measures the likelihood of a customer recommending your florist shop. High NPS reflects loyalty.
  • Repeat Business: Percentage of customers who return for subsequent purchases. Build a loyal customer base.
  • Online Reviews: Monitor and address customer feedback on platforms like Google, Yelp, or industry-specific sites.

Operational KPIs

  • Cost of Goods Sold (COGS): The direct cost of flowers, vases, and other materials used in creating arrangements.
  • Shrinkage/Waste: Track the percentage of flowers and supplies lost due to spoilage, damage, etc. Minimize waste to optimize profits.
  • Order Fulfillment Time: Average time from when an order is placed to when it’s ready for pickup or delivery.
  • Delivery Accuracy: Percentage of orders delivered to the correct location and on-time. Customer experience is vital.

Financial KPIs

  • Gross Profit Margin: Percentage of revenue remaining after your COGS are accounted for.
  • Net Profit Margin: Percentage of revenue remaining after all expenses are accounted for. Measures overall profitability.

Additional Considerations

  • Seasonality KPIs Track how sales fluctuate throughout the year due to holidays (Valentine’s Day, Mother’s Day, etc.) and events (weddings). Plan accordingly!
  • Social Media Engagement: Track likes, shares, comments, and followers on social media platforms. Especially important if you promote visually appealing floral work.

Fitness and Health

Fitness and Health

Key Performance Indicator (KPI) for Fitness and Health

To name a few:

Membership & Client KPIs

  • Member Acquisition Rate: The rate at which you acquire new gym members or clients. Tracks growth.
  • Member Retention Rate: Percentage of members who renew their memberships over a given period. High retention means satisfied customers.
  • Churn Rate: The percentage of members who cancel their memberships. Focus on keeping churn low.
  • Customer Lifetime Value (CLV): The projected revenue a member will generate over their time with your gym or a client over their relationship with your services.
  • Net Promoter Score (NPS): Measures the likelihood of your clients recommending your facility or services.

Engagement KPIs

  • Average Visits per Member: How often members attend the gym or utilize your services. Higher frequency is a good sign.
  • Class Attendance: Track attendance for your group fitness classes to assess popularity and instructor effectiveness.
  • Personal Training Session Bookings: Track the number of personal training sessions booked. This revenue stream can be significant.
  • App Usage (if applicable): Measure active users and engagement with your fitness app or health tracking software.

Financial KPIs

  • Revenue per Member: Average revenue generated per member over a defined period.
  • Profit Margin: Percentage of revenue remaining after all expenses are accounted for. Measures overall financial health.
  • Customer Acquisition Cost (CAC): Cost to acquire a new member or client. Manage this relative to CLV.
  • Revenue Growth: Measures the increase in revenue over time. Are you expanding or contracting your business?

Operational KPIs

  • Peak Hour Utilization: Percentage of your capacity used during your busiest times. Helps adjust staffing and manage space usage.
  • Staff Retention: Track how long your employees stay with you. Low turnover reduces training costs and promotes knowledgeable staff.
  • Equipment Maintenance Costs: Manage expenses for repairs and upkeep of your fitness equipment.
  • Client Goal Achievement: If possible, track whether clients are achieving their fitness or health goals (weight loss, improved fitness levels, etc.). This shows the true value of your services.

Additional Considerations

  • Social Media Engagement: Track likes, shares, comments, and followers for a sense of your online reach.
  • Wearable Tech Integration: If relevant, track how members or clients use wearables with your services, providing additional data points.

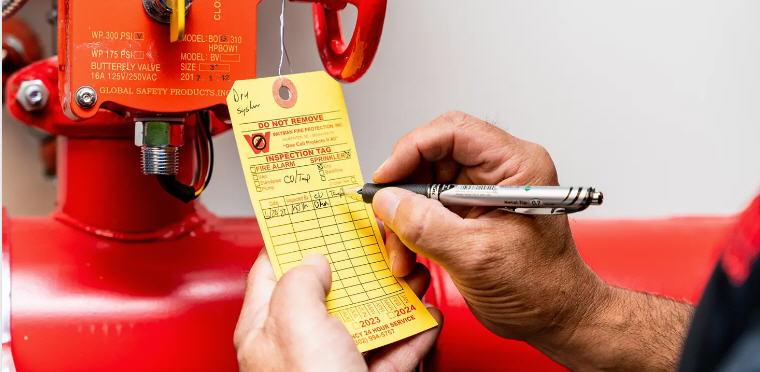
Fire Protection Service

Fire Protection Service

Key Performance Indicator (KPI) for Fire Protection Service

To name a few:

Service-Focused KPIs

  • Response Time: Average time it takes to arrive at a client’s location after a service call, emergency dispatch, or alarm trigger. Faster response enhances safety.
  • First Time Fix Rate: Percentage of service calls resolved on the first visit without needing follow-ups. High rates improve efficiency and customer satisfaction.
  • Customer Satisfaction Surveys (CSAT): Track customer satisfaction with the quality of work, communication, reliability, etc.
  • Net Promoter Score (NPS): Measures the likelihood of a customer recommending your services. Strong NPS reflects excellent service.
  • Contract Renewal Rate: Percentage of maintenance and inspection contracts renewed annually.

Operational KPIs

  • Inspection Compliance Rate: Percentage of scheduled inspections completed on time as mandated by regulations or contracts.
  • Technician Utilization: Percentage of technician’s working hours spent on billable service tasks vs. travel, admin, etc. Higher utilization boosts productivity.
  • Mean Time to Repair (MTTR): Average time to restore a system to working order after a failure or malfunction.
  • Safety Incident Rate: Track accidents and injuries to promote a safe work environment for your team.
  • Preventative Maintenance Effectiveness: Measure any reduction in emergency calls or system failures due to proactive maintenance.

Financial KPIs

  • Revenue per Technician: Total revenue generated per technician over a defined period. Helps in understanding productivity and workforce efficiency.
  • Profit Margin: Percentage of revenue remaining after all expenses are accounted for. Measures overall profitability.
  • Average Contract Value: Average value of service contracts, both installation and maintenance agreements.
  • Recurring Revenue: Percentage of revenue from ongoing service contracts (vs. one-off installations). Recurring revenue provides stability.

Project Management KPIs (for larger projects)

  • On-Time Project Completion: Percentage of projects completed within the originally agreed upon schedule.
  • On-Budget Project Completion: Percentage of projects completed within or under the original project budget.
  • Change Orders: Value of change orders as a percentage of total contract value. Higher numbers might suggest initial planning issues.

Additional Considerations

  • Equipment-Specific KPIs: Track reliability rates, maintenance frequency, and the lifetime cost of ownership for various types of fire protection equipment.
  • Regulatory Compliance: Ensure your team is always up-to-date on and adhering to the latest fire codes and industry regulations

Financial Service

Financial Service

Key Performance Indicator (KPI) for Financial Service

To name a few:

Client & Sales KPIs

  • Assets Under Management (AUM): Total value of assets that an investment firm or advisor manages on behalf of clients. Measures scale and growth.
  • Customer Acquisition Cost (CAC): The average cost of acquiring a new customer. Helps manage marketing and sales expenses.
  • Customer Lifetime Value (CLV): Projected total revenue a customer generates over their relationship with your firm.
  • Client Retention Rate: Percentage of clients who continue using your services year over year. Strong retention is crucial.
  • Net Promoter Score (NPS): Measures the likelihood of clients recommending your services. High NPS reflects loyalty.

Investment Performance KPIs

  • Return on Investment (ROI): Percentage return on a portfolio or investment over a specific period. The core measure of investment success.
  • Alpha: Measures the performance of an investment compared to a benchmark index, adjusted for risk. Positive alpha indicates outperformance.
  • Beta: Measures a security’s volatility in relation to the overall market. High beta means higher risk and volatility.
  • Sharpe Ratio: Measures risk-adjusted return. Higher Sharpe ratios indicate better investment performance relative to risk taken.
  • Expense Ratio (for funds): Percentage of assets deducted each year to cover a fund’s operational costs. Lower is better for investors.

Financial KPIs

  • Profit Margin: Percentage of revenue remaining after all expenses are accounted for. Measures overall profitability.
  • Return on Assets (ROA): Net income divided by total assets. Measures how effectively a firm uses assets to generate profit.
  • Return on Equity (ROE): Net income divided by shareholder equity. A vital measure of profitability for investors.
  • Cost-to-Income Ratio: Operating expenses as a percentage of revenue. Lower ratios indicate greater efficiency.

Risk Management KPIs

  • Value at Risk (VaR): Estimates the maximum potential loss on a portfolio over a given timeframe with a certain confidence level.
  • Credit Risk Exposure: Measures potential losses from defaults by borrowers or counterparties.
  • Liquidity Risk: Measures a firm’s ability to meet its financial obligations as they come due. Adequate liquidity is crucial.
  • Regulatory Compliance: Track adherence to all relevant financial regulations and identify any potential violations.

Insurance-Specific KPIs

  • Loss Ratio: Total losses incurred (claims paid) divided by premiums earned. Lower ratios suggest better underwriting and profitability.
  • Combined Ratio: Loss ratio plus expense ratio. A ratio below 100% generally indicates an insurer is underwriting profitably.
  • Policy Retention Rate: Percentage of policies renewed at the end of their term. High retention lowers acquisition costs.

Printing Companies

Printing Companies

Key Performance Indicator (KPI) for Printing Companies

To name a few:

Production & Sales KPIs

  • Production Throughput: The volume of printed materials produced per unit of time (hour, day, etc.). Tracks your output capacity.
  • Turnaround Time: Average time from receiving a print order to final delivery. Faster turnaround times improve client satisfaction.
  • Sales Conversion Rate: Percentage of printing inquiries or quotes that turn into paying jobs. Shows effectiveness of your sales process.
  • Average Job Size: Average revenue generated per printing job. Larger job sizes often lead to higher revenue.
  • Sales Growth: Increase in revenue over time. Are you expanding your sales?

Customer-Focused KPIs

  • Customer Satisfaction Surveys (CSAT): Measure customer satisfaction with print quality, pricing, turnaround time, communication, etc.
  • Net Promoter Score (NPS): Measures the likelihood of clients recommending your printing services to others.
  • Repeat Business: Percentage of business coming from existing customers. Builds a loyal client base.
  • Client Retention Rate: The percentage of clients you keep over a given period. High retention means satisfied clients.

Operational KPIs

  • Waste Percentage: The percentage of materials wasted due to errors, spoilage, or overruns. Reducing waste protects your profits.
  • Press Uptime: Percentage of time your printing presses are operational. Higher uptime means greater productivity.
  • Makeready Time: The time spent setting up a printing press for a new job. Shorter makeready time improves efficiency.
  • Changeovers: Number of press changeovers per shift or day. Too many changeovers can disrupt output and efficiency.

Financial KPIs

  • Gross Profit Margin: Percentage of revenue remaining after your direct costs of printing (ink, paper, labor) are accounted for.
  • Net Profit Margin: Percentage of revenue remaining after all expenses are accounted for. Measures overall profitability.
  • Cost per Impression: Cost to produce one single printed piece. Helps manage pricing and profitability.
  • Inventory Turnover: How quickly you sell and replace your printing supplies. High turnover generally indicates good inventory management.

Additional Considerations

  • Job Type KPIs: Analyze sales, profitability, and production metrics by job type (brochures, packaging, signage, etc.).
  • Print Technology KPIs: If you offer different printing methods, track performance metrics relevant to each type (digital, offset, etc.).

Hotel

Hotel

Key Performance Indicator (KPI) for Hotel

 
To name a few:

Revenue KPIs

  • Occupancy Rate: Percentage of available rooms occupied on a given night or over a certain period. This is the overarching measure of how well you’re filling your hotel.
  • Average Daily Rate (ADR): Average rate paid per occupied room during a certain period. Higher ADR drives revenue.
  • Revenue per Available Room (RevPAR): A key industry metric combining occupancy and rate (ADR x Occupancy Rate). Tracks overall revenue generating ability
  • Revenue per Guest: Average revenue generated per guest. This can be increased through additional services and sales beyond the room rate.
  • Market Share: The percentage of rooms you sell compared to your competitors within a specified market.

Customer-focused KPIs

  • Guest Satisfaction Surveys (GSAT): Measure guest satisfaction with various aspects of their stay, including rooms, service, amenities, etc.
  • Net Promoter Score (NPS): Measures the likelihood of a guest recommending your hotel to others. High NPS indicates loyalty.
  • Online Reviews: Monitor reviews on platforms like TripAdvisor, Expedia, and Google, and address common themes in feedback.
  • Repeat Guests: Track the percentage of guests who return to your hotel for future stays. Loyal customers are valuable.

Operational KPIs

  • Cost per Occupied Room (CPOR): Total operating expenses incurred divided by the number of occupied rooms. Helps measure operational efficiency.
  • Labor Cost per Occupied Room: Tracks labor expenses relative to occupancy. Managing labor costs is significant for profitability.
  • Ancillary Revenue: Revenue from sources beyond room rates, such as food and beverage, spa services, or event space rentals.
  • Booking Channel Mix: Track how bookings come in – website, third-party sites, direct, etc. Helps understand distribution costs.

Financial KPIs

  • Gross Operating Profit Per Available Room (GOPPAR): Gross operating profit divided by available rooms. Key to profitability tracking, allowing comparison across properties of different sizes.
  • Net Operating Income (NOI): Total revenue minus operating expenses. Measures a property’s profitability before debt and taxes.
  • Profit Margin: Percentage of revenue remaining after all expenses are accounted for. Measures overall profitability.

Additional Considerations

  • Seasonality KPIs: Track how occupancy, rates, and revenue fluctuate based on the time of year. Crucial for planning.
  • Group Bookings: If you cater to groups, track their contribution to occupancy, revenue, and ancillary spending.

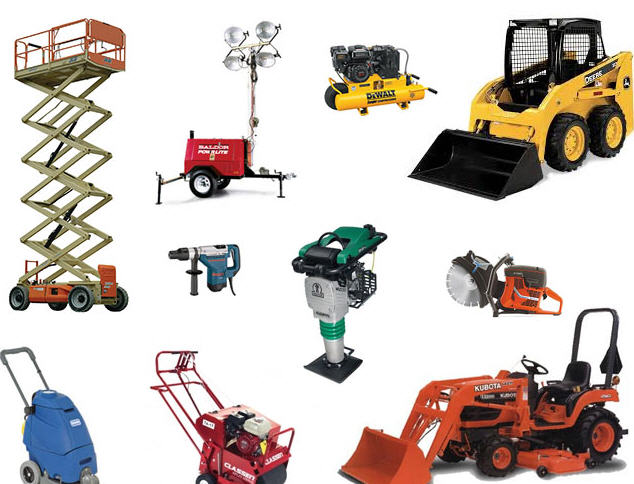
Equipment Rental

Equipment Rental

Key Performance Indicator (KPI) for Equipment Rental

To name a few:

Operational KPIs

  • Utilization Rate: Percentage of available rental hours when equipment is out on rent. High utilization maximizes revenue potential.
  • Time on Rent (TOR): Average number of days equipment is rented out per rental period. Longer rentals improve utilization.
  • Average Rental Rate (ARR): Average revenue generated per day or per period for a piece of equipment.
  • Fleet Availability: Percentage of equipment that’s ready to rent vs. those in repair or awaiting maintenance. Maximizing available fleet avoids lost revenue.
  • Maintenance Costs: Track costs of repairs, preventive maintenance, and downtime for equipment. Manage expenses closely to protect profits.

Financial KPIs

  • Revenue per Available Unit: Revenue generated per piece of equipment within your fleet. Helps measure asset productivity.
  • Gross Profit Margin: Percentage of revenue remaining after direct rental costs (depreciation, maintenance, fuel) are accounted for.
  • Net Profit Margin: Percentage of revenue remaining after all expenses are accounted for. Measures overall profitability.
  • Return on Assets (ROA): Net income divided by total assets. Measures how effectively you utilize equipment assets to generate profit.

Customer-Focused KPIs

  • Customer Satisfaction Surveys (CSAT): Measure satisfaction with equipment quality, service, availability, and pricing.
  • Net Promoter Score (NPS): Measures the likelihood of a customer recommending your rental company to others.
  • Repeat Business Rate: Percentage of customers who come back to rent from you again. Loyal customers are vital.
  • On-Time Delivery and Pickup: Track your reliability in deliveries and pickups as this heavily impacts customer experience.

Logistics-Focused KPIs

  • Transportation Costs: Track costs associated with transportation of equipment to and from customer sites. Manage this for profitability.
  • Delivery Accuracy: Percentage of deliveries made to the right location and at the agreed-upon time. Impacts customer satisfaction.
  • Idle Time: Percentage of time equipment sits unused when not being repaired. Minimizing idle time improves utilization.

Additional Considerations

  • Equipment-Specific KPIs: Track utilization, revenue, profitability, and maintenance costs for each type or major piece of equipment in your fleet.
  • Seasonal KPIs: Track how utilization and revenue change due to seasonality, weather, and local construction activity.

Cosmetic & Beauty

Cosmetic & Beauty

Key Performance Indicator (KPI) for Cosmetic & Beauty

To name a few:

Sales and Revenue KPIs

  • Sales Revenue: Total revenue generated during a specific period. The most basic measure of sales performance.
  • Sales Growth: Increase in sales revenue over time, showing if you’re growing or shrinking.
  • Average Order Value (AOV): Average amount spent per customer order. Increasing AOV boosts revenue.
  • Units per Transaction (UPT): Average number of items purchased per transaction. Similar to AOV, boosting it drives more revenue.
  • Sell-Through Rate: Percentage of inventory sold within a given timeframe. Helps identify fast-moving vs. slow-moving products.

Marketing & Social Media KPIs

  • Website Traffic: Number of visitors to your online store or informational website. Indicates your online reach.
  • Social Media Engagement: Track likes, shares, comments, and followers on platforms relevant to your target audience.
  • Conversion Rate: Percentage of website visitors or social media followers who become paying customers. Measures the effectiveness of your online presence.
  • Customer Acquisition Cost (CAC): Cost to acquire a new customer through marketing and sales efforts. Monitor this to manage marketing spend.
  • Influencer Marketing ROI: If you work with influencers, track the sales impact of their campaigns.

Customer-focused KPIs

  • Customer Satisfaction Surveys (CSAT): Measure satisfaction with product quality, shopping experience, customer service, etc.

  • Net Promoter Score (NPS): Measures the likelihood of a customer recommending your brand or products. High NPS indicates customer loyalty.

  • Repeat Purchase Rate: Percentage of customers who make multiple purchases. Builds a loyal customer base.

  • Online Reviews: Monitor reviews on Google, specific beauty sites, and your own website. Address common complaints or feedback.

Product Development KPIs

  • New Product Success Rate: Percentage of new products meeting or exceeding sales goals.
  • Time to Market: Measures the time taken to bring a new product from concept to launch. Faster is often better for competitive advantage.
  • Product Return Rate: Percentage of products returned due to dissatisfaction or defects. Lower return rates are ideal.

Financial KPIs

  • Gross Profit Margin: Percentage of revenue remaining after accounting for the cost of goods sold (COGS).
  • Net Profit Margin: Percentage of revenue remaining after all expenses are accounted for. Measures overall profitability.
  • Inventory Turnover Ratio: How frequently inventory is sold and replenished over a period. High turnover often indicates healthy demand and efficient stock management.

Additional Considerations

  • Product- or Category-Specific KPIs: Analyze sales, profitability, and customer feedback by specific product lines or categories.
  • Trend Analysis: Track the impact of beauty trends on your sales and product development. Helps you adapt and remain relevant.

Construction Industry

Construction Industry

Key Performance Indicator (KPI) for Construction Industry

To name a few:

Project Delivery KPIs

  • On-Time Project Completion: Percentage of projects completed within the original schedule. Meeting deadlines is crucial.
  • On-Budget Project Completion: Percentage of projects completed within the original budget. Helps manage costs and profitability.
  • Change Orders: Number and value of change orders as a percentage of original contract value. High rates may indicate poor initial planning or scope changes.
  • Schedule Performance Index (SPI): Measures if a project is running ahead of or behind schedule (ratio of earned value vs. planned value).
  • Cost Performance Index (CPI): Measures if a project is over or under budget (ratio of earned value vs. actual cost).

Financial KPIs

  • Gross Profit Margin: Percentage of revenue remaining after direct costs of projects are accounted for (labor, materials, etc.).
  • Net Profit Margin: Percentage of revenue remaining after all expenses are accounted for. Measures overall profitability.
  • Overhead Rate: Indirect expenses of running your business divided by total direct labor costs. Managing overhead is key.
  • Backlog: Total value of contracted work pending completion. Shows work pipeline and future revenue potential.

Safety KPIs

  • Incident Rate: Number of workplace injuries or accidents per 200,000 hours worked (industry standard calculation). Lower is better.
  • OSHA Recordable Incident Rate: Number of OSHA-recordable injuries or illnesses per 200,000 hours. Tracks serious incidents.
  • Days Away, Restricted, or Transferred (DART) Rate: Measures incidents serious enough to result in lost workdays.
  • Near-Miss Reporting: Encouraging reporting of near-misses improves proactive safety management.

Client-Focused KPIs

  • Client Satisfaction Surveys (CSAT): Measure satisfaction with projects, communication, etc.
  • Net Promoter Score (NPS): Tracks the likelihood of clients recommending your work.
  • Repeat Business: Percentage of work coming from existing clients. Builds a loyal base and reduces sales costs.
  • Customer Disputes: Number and severity of disputes or claims with clients.

Operational KPIs

  • Rework: The percentage of work needing to be re-done due to errors or changes. Minimize for improved efficiency.
  • Warranty Claims: Track the cost and frequency of fixing work under warranty, which can signal quality issues.
  • Equipment Utilization: Track use of owned or rented equipment to maximize its value and ROI.
  • Materials Waste: Percentage of materials wasted due to damage, over-ordering, etc. Control waste to improve project margins.

Coffee Shop

Coffee Shop

Key Performance Indicator (KPI) for Coffee Shop

To name a few:

Sales and Revenue KPIs

  • Total Revenue: Total sales within a specific period (daily, weekly, etc.). This is your top-level sales metric.
  • Sales Growth: Increase (or decrease) in revenue over time. Are your sales expanding or contracting?
  • Average Transaction Value (ATV): Average amount a customer spends per transaction. Higher ATV drives more revenue.
  • Items per Transaction: Average number of items bought by each customer. Similar to ATV, boosting items per customer grows revenue.
  • Revenue per Labor Hour: Revenue generated per hour of labor worked. Helps in managing labor efficiency.

Customer-Focused KPIs

  • Customer Satisfaction Surveys (CSAT): Track satisfaction with drinks, food, ambiance, service, etc.
  • Net Promoter Score (NPS): Measures the likelihood of a customer recommending your coffee shop.
  • Repeat Customers: Percentage of customers who return. Builds loyalty and repeat business.
  • Online Reviews: Monitor reviews on platforms like Google, Yelp, or industry-specific sites. Gauge and respond to customer sentiment.
  • Peak Hour Foot Traffic: Number of customers during your busiest time periods. Helps manage staffing needs.

Operations & Cost Management KPIs

  • Cost of Goods Sold (COGS): Direct costs of your coffee beans, food ingredients, packaging, etc. Managing COGS is vital for profitability.
  • Labor Cost Percentage: Percentage of revenue spent on staff wages. This is often your largest expense.
  • Food Waste: Track amount of food wasted due to spoilage, overproduction, etc. Minimize waste to protect profits.
  • Cups of Coffee per Pound: How many cups of coffee you yield from a pound of beans. Helps manage coffee costs.
  • Speed of Service: Average time from when a customer orders to when their order is ready.

Financial KPIs

  • Gross Profit Margin: Percentage of revenue remaining after accounting for COGS.
  • Net Profit Margin: Percentage of revenue remaining after all expenses are accounted for. Measures overall profitability.
  • Break-even Point: The level of sales you need to achieve to cover all costs without making a profit or loss.

Additional Considerations

  • Product-Specific KPIs: Analyze sales, profit margins, and waste levels for specific drinks or food items to help with menu optimization.
  • Loyalty Programs: If you offer a loyalty program, track participation, reward redemption, and impact on sales.
  • Seasonality: Track sales fluctuations due to holidays, weather, and local events. This is key for planning.