Moving Company

Moving Company

Key Performance Indicator (KPI) for Moving Company

 
To name a few:

KPIs for moving companies (residential, commercial, long-distance, local) will affect some priorities, choose the KPIs most relevant to your niche.

Operational KPIs

  • Jobs Completed per Time Period: Number of moving jobs successfully completed within a given time frame (day, week, month). Primary metric of workload.
  • On-Time Completion Rate: Percentage of moves completed on or before the scheduled date and time.
  • Damage Rate: Percentage of moves resulting in damaged belongings. Minimize this to maintain reputation and avoid costs.
  • Truck/Vehicle Utilization: Percentage of time your moving trucks or vehicles are in use and generating revenue. Maximize utilization.
  • Fuel Efficiency: Track fuel costs per mile or per move. Good fuel efficiency reduces operating costs.

Customer-Focused KPIs

  • Customer Satisfaction Surveys (CSAT): Measure satisfaction with the moving process, crew professionalism, pricing, communication, etc.
  • Net Promoter Score (NPS): Tracks the likelihood of a customer recommending your moving services. High NPS reflects satisfied customers.
  • Repeat Business: Percentage of customers who use your services multiple times. Builds a loyal client base.
  • Online Reviews: Monitor reviews on platforms like Google, Yelp, or industry-specific sites. Understand how customers perceive your business.
  • Claims Rate: Track the number of claims filed by customers for lost or damaged items. Impacts both costs and reputation.

Sales & Revenue KPIs

  • Revenue Growth: Are your sales expanding or contracting over time? Track the health of your business.
  • Average Revenue per Move: Helps understand the profitability of your services.
  • Lead Conversion Rate: Percentage of inquiries or estimates that turn into actual moving jobs. Tracks sales process effectiveness.
  • Sales by Service Type: Analyze revenue generated by different types of moves (residential, commercial, long-distance, etc.). Helps you focus efforts.

Financial KPIs

  • Gross Profit Margin: Percentage of revenue remaining after direct costs of the move (labor, fuel, truck expenses) are accounted for.
  • Net Profit Margin: Percentage of revenue remaining after all expenses are accounted for. Measures overall profitability.
  • Overhead Costs: Track indirect operating expenses. These impact your overall profitability.

Additional Considerations

  • Seasonality KPIs: Track how revenue and demand fluctuate throughout the year due to moving season peaks and valleys. Plan accordingly!
  • Lead Sources: Track where leads come from (website, referrals, etc.), to optimize your marketing spend.

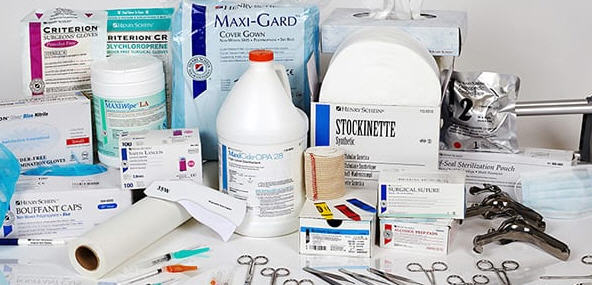
Medical Supply

Medical Supply

Key Performance Indicator (KPI) for Medical Supply

To name a few:

KPIs will depend on your specific business model: manufacturer, distributor, or retailer of medical equipment and supplies.

Sales and Growth KPIs

  • Total Revenue: Total sales generated during a specific period. This is your top-line sales metric.
  • Sales Growth: Increase in revenue over time. Are your sales expanding or contracting?
  • Average Order Value (AOV): Average amount spent per customer order. Increasing AOV drives more revenue.
  • Customer Lifetime Value (CLV): Projected total revenue a customer generates over their relationship with your business.
  • New Customer Acquisition: Number of new customers acquired during a given period. Helps track growth.

Customer-Focused KPIs

  • Customer Satisfaction Surveys (CSAT): Measure satisfaction with product quality, pricing, availability, ordering process, customer service, etc.
  • Net Promoter Score (NPS): Tracks the likelihood of a customer recommending your products and services. Indicates customer loyalty.
  • Repeat Customers: Percentage of customers who make multiple purchases. Builds a loyal customer base and repeat sales.
  • Backorder Rate: Percentage of orders that cannot be fulfilled immediately due to insufficient stock. Lower is better to avoid frustrating customers.

Inventory & Supply Chain KPIs

  • Inventory Turnover Ratio: How frequently inventory is sold and replenished over a period. High turnover often indicates healthy demand and efficient management.
  • Days Inventory Outstanding (DIO): Average number of days inventory is held before being sold. Shorter DIO indicates better cash flow.
  • Stockouts: Instances where demand cannot be met due to a lack of product availability. Lost sales and frustrated customers.
  • On-Time Delivery (OTD): Percentage of orders shipped and delivered on schedule. Reliability is vital for medical customers.
  • Expired Inventory: Track the amount of inventory that expires before it can be sold, often a critical issue for medical supplies.

Financial KPIs

  • Gross Profit Margin: Percentage of revenue remaining after direct costs of goods sold (COGS) are accounted for.
  • Net Profit Margin: Percentage of revenue remaining after all expenses are accounted for. Measures overall profitability.
  • Days Sales Outstanding (DSO): Average time it takes to collect payment from customers. Lower DSO improves cash flow.
  • Cost of Goods Sold (COGS): Direct costs associated with the medical supplies you sell. Managing COGS is key to profitability.

Product-Focused KPIs

  • Sales by Product Category: Track sales for different medical supply categories (disposables, durable equipment, etc.). Helps you optimize inventory and promotions.
  • Product Margins: Analyze profit margins for different product lines.

Additional Considerations

  • Regulatory Compliance: Ensure you adhere to all industry regulations regarding product safety, quality, and record-keeping.
  • Reimbursement KPIs: If you work with healthcare providers, track reimbursement rates and billing accuracy for insurance claims. Affects cash flow.

Media Industry

Media Industry

Key Performance Indicator (KPI) for Media Industry

To name a few:

KPIs will depend on your specific focus (traditional publishing, digital content, broadcasting, etc.).

Audience Engagement KPIs

  • Audience Size/Reach: The total number of people your content reaches across various platforms (website visitors, viewers, listeners, social followers).
  • Pageviews: Number of times a page on your website is viewed. Helps measure overall traffic.
  • Average Session Duration: The average amount of time a user spends on your website or app per visit. Longer durations suggest engaged users.
  • Shares, Likes, Comments: Track engagement with your content on social media platforms.
  • Subscriber Growth: Track the increase in subscribers to your publications, newsletters, or streaming services.
  • Time Spent Viewing/Listening: For video or audio content, track the average amount of time users spend actively consuming the media.

Content Performance KPIs

  • Click-Through Rate (CTR): Percentage of people who click on a link, ad, or call to action after seeing it.
  • Conversion Rate: Percentage of visitors who take a desired action (subscribe, make a purchase, etc.). Higher conversion is better.
  • Virality: Measure how quickly and widely a piece of content is shared. Viral content helps boost reach.
  • Top Performing Content: Identify articles, videos, or social posts that generate the highest engagement, traffic, or conversions.

Revenue KPIs

  • Total Revenue: Overall revenue generated from subscriptions, advertising, or other sources.
  • Subscriber Revenue: Revenue specifically from subscription fees or memberships.
  • Advertising Revenue: Revenue generated from selling advertising space or placements.
  • Revenue per User (RPU): Average revenue generated per user or subscriber. Understanding RPU is crucial for various media models.
  • Customer Acquisition Cost (CAC): Cost to acquire a new paying subscriber or customer. Tracks marketing and sales expenses.

Financial KPIs

  • Profit Margin: Percentage of revenue remaining after all expenses are accounted for. Measures overall profitability.
  • Customer Lifetime Value (CLV): Projected total revenue a subscriber generates over their relationship with your media service or publication.
  • Churn Rate: Percentage of subscribers who cancel their subscriptions within a given period. Lower churn indicates customer loyalty.

Additional Considerations

  • Search Engine Optimization (SEO): If you rely on organic search traffic, track keyword rankings and search impressions.
  • Brand Awareness: Track surveys or social media mentions that gauge overall brand recognition in your market.
  • Niche-Specific KPIs: Analyze metrics unique to your type of media, like circulation for print magazines or ratings for broadcasting.

Manufacturing Sector

Manufacturing Sector

Key Performance Indicator (KPI) for Manufacturing Sector

To name a few:

Production KPIs

  • Overall Equipment Effectiveness (OEE): A comprehensive metric combining equipment availability, performance, and quality. Higher OEE indicates greater manufacturing efficiency.
  • Production Output: Total quantity of goods produced in a given period. Primary measure of production volume.
  • Throughput Time: The time it takes for raw materials to move through the production process and become finished goods. Shorter times equal faster output.
  • Capacity Utilization: Percentage of your manufacturing capacity that is actually being used. Helps identify opportunities and bottlenecks.
  • Yield Rate: Percentage of manufactured units that meet quality standards and are sellable. High yield reduces waste and increases profits.

Quality KPIs

  • Defect Rate: Percentage of manufactured units with defects or quality issues. Lower is better to minimize waste and rework.
  • Customer Returns: Track the number or percentage of products returned by customers due to defects or quality problems.
  • Scrap Rate: Percentage of materials or products wasted during the manufacturing process due to defects or errors.
  • Rework Rate: Percentage of products requiring additional work to correct issues found during quality control.
  • First Pass Yield: Percentage of products that pass quality control without needing rework. Higher is better for efficiency.

Financial KPIs

  • Cost of Goods Manufactured (COGM): Total costs involved in producing finished goods, including materials, labor, and manufacturing overhead.
  • Gross Profit Margin: Percentage of revenue remaining after the COGM is accounted for.
  • Net Profit Margin: Percentage of revenue remaining after all expenses are accounted for. Measures overall profitability.
  • Inventory Turnover: How frequently inventory is sold and replenished over a period. High turnover often indicates healthy demand and efficient management.
  • Return on Assets (ROA): Net income divided by total assets. Measures how effectively a company uses its assets to generate profit.

Safety & Maintenance KPIs

  • Safety Incident Rate: Number of workplace injuries or accidents per 200,000 hours worked (industry standard calculation). Safety is always a top priority.
  • OSHA Recordable Incident Rate: Number of OSHA-recordable injuries or illnesses per 200,000 hours. Tracks serious incidents.
  • Downtime: Total time production equipment is out of service due to breakdowns or planned maintenance. Minimize downtime to maintain output.
  • Mean Time to Repair (MTTR): Average time it takes to fix equipment failures and restore them to operation. Shorter MTTR means less downtime.

Supply Chain KPIs

  • On-Time Delivery (OTD): Percentage of supplier deliveries arriving on or before the agreed-upon date. Reliability is crucial.
  • Supplier Quality: Track defects or quality issues found in incoming materials and components.
  • Lead Time: The time it takes from placing an order with a supplier to the time the materials are received.
  • Inventory Days on Hand: Average number of days inventory is held before being used in production or sold.

Lighting Service

Lighting Service

Key Performance Indicator (KPI) for Lighting Service

To name a few:

The most relevant KPIs will vary depending on your specialization (residential, commercial, design services, energy-efficient retrofits, etc.).

Project & Service KPIs

  • Project Completion Rate: Percentage of lighting projects completed on time and on budget. Meeting deadlines and budgets is key.
  • Customer Satisfaction Surveys (CSAT): Measure satisfaction with design, installation quality, product performance, communication, and overall experience.
  • Net Promoter Score (NPS): Tracks the likelihood of a client recommending your services. Strong NPS reflects customer loyalty.
  • Repeat Business: Percentage of business coming from existing clients. Builds a loyal client base.
  • Service Call Response Time: Average time it takes to respond to a client request for service or repair. Faster response enhances customer satisfaction.

Sales & Revenue KPIs

  • Revenue Growth: Are your sales expanding or contracting over time? Track the health of your business.
  • Average Project Value: Average revenue generated per lighting project. Helps understand the scope of your work.
  • Sales Conversion Rate: Percentage of proposals or estimates that turn into paying projects. Tracks sales process effectiveness.
  • Sales Pipeline Value: Total estimated value of potential projects currently in your pipeline. Helps project future workload and revenue potential.

Financial KPIs

  • Gross Profit Margin: Percentage of revenue remaining after direct costs of service (labor, materials) are accounted for.
  • Net Profit Margin: Percentage of revenue remaining after all expenses are accounted for. Measures overall profitability.
  • Overhead Costs: Track indirect operating expenses, as these impact your overall profitability.
  • Cost per Luminaire: If you sell lighting fixtures, analyze average costs per fixture, ensuring your pricing aligns with profitability targets.

Energy Efficiency KPIs

  • Energy Savings: Quantify the energy reduction (kWh) achieved for clients through lighting upgrades or retrofits.
  • ROI on Energy Projects: Calculate the return on investment for clients who undertake energy-efficient lighting projects. Strong ROI helps drive sales.
  • Lighting Control Systems: If you offer smart lighting control, track installations and energy savings achieved using those systems.

Operational KPIs

  • Warranty Claims: Track the frequency and cost of fixing work under warranty, which can signal product or installation quality issues.
  • Technician Utilization Rate: Percentage of working time technicians spend on billable projects vs. travel, administration, etc. Higher utilization boosts revenue potential.
  • Inventory Turnover: How frequently you sell and replace your inventory of fixtures or replacement parts. Good turnover improves cash flow

Insurance

Insurance

Key Performance Indicator (KPI) for Insurance

To name a few:

Since different insurers focus on various lines of business (life, health, property & casualty, etc.), the most relevant KPIs will vary slightly.

Customer-focused KPIs

  • Customer Acquisition Cost (CAC): Average cost to acquire a new policyholder. Track in relation to Customer Lifetime Value.
  • Customer Retention Rate: Percentage of policyholders who renew their coverage at the end of the term. High retention lowers acquisition costs.
  • Customer Lifetime Value (CLV): Projected revenue a customer generates over their relationship with your company.
  • Net Promoter Score (NPS): Tracks the likelihood of a customer recommending your insurance company. High NPS reflects loyalty.
  • Customer Satisfaction Surveys (CSAT): Measure satisfaction with pricing, claims experience, customer service, etc.

Sales & Growth KPIs

  • Premium Growth: Percentage increase in written premiums over time. Tracks overall business expansion.
  • New Policies Sold: Number of new policies written in a given period. Helps track growth and market penetration.
  • Conversion Rate: Percentage of leads or quotes that turn into paying customers. Tracks sales process effectiveness.
  • Market Share: Percentage of total premiums in a specific market or for a particular line of insurance that your company captures.

Underwriting KPIs

  • Loss Ratio: Total losses incurred (claims paid) divided by premiums earned. Lower ratios suggest better underwriting and profitability.
  • Combined Ratio: Loss ratio plus expense ratio. A ratio below 100% generally indicates an insurer is underwriting profitably.
  • Profit per Policy: Average profit generated per insurance policy. Helps understand underwriting and pricing decisions.
  • Underwriting Cycle Time: The time taken to evaluate risk, determine pricing, and issue a policy. Faster turnaround times can improve customer experience.

Financial KPIs

  • Return on Equity (ROE): Net income divided by shareholder equity. A vital measure of profitability for investors.
  • Expense Ratio: Operating expenses as a percentage of premiums earned. Lower ratios indicate greater efficiency.
  • Claims Processing Cost: Average cost to process an insurance claim. Efficient claims management reduces expenses.
  • Investment Income: Income earned from investing the premiums collected. A significant revenue source for many insurers.

Operational KPIs

  • Claims Cycle Time: Average time to settle a claim from initial filing to payout. Faster resolution enhances customer satisfaction.
  • Claims Accuracy: Percentage of claims paid out correctly as per the policy terms. High accuracy reduces disputes.
  • Policy Lapse Rate: Percentage of policies that terminate before their intended term due to non-payment or cancellation.

Industrial Supplies

Industrial Supplies

Key Performance Indicator (KPI) for Industrial Supplies

To name a few:

KPIs for the industrial supplies industry. The most relevant ones depend on whether you’re a manufacturer, distributor, or specialized supplier of specific industrial products.

Sales and Revenue KPIs

  • Total Revenue: Total sales generated during a specific period (daily, weekly, etc.). This is your top-line sales metric.
  • Sales Growth: Increase (or decrease) in revenue over time. Are your sales expanding or shrinking?
  • Average Order Value (AOV): Average amount spent per customer order. Increasing AOV drives more revenue.
  • Customer Lifetime Value (CLV): Projected total revenue a customer generates over their relationship with your business.
  • New Customer Acquisition: Number of new customers acquired during a given period. Helps track growth.

Inventory & Supply Chain KPIs

  • Inventory Turnover Ratio: How frequently inventory is sold and replenished over a period. High turnover often indicates healthy demand and efficient management.
  • Days Inventory Outstanding (DIO): Average number of days inventory is held before being sold. Shorter DIO indicates better cash flow.
  • Stockouts: Instances where demand cannot be met due to a lack of product availability. Lost sales and frustrated customers.
  • On-Time Delivery (OTD): Percentage of orders shipped and delivered on schedule. Reliability is vital for industrial customers.
  • Lead Time: Time taken to procure products from suppliers and make them available to the customer. Shorter lead times are competitive advantages.

Customer-Focused KPIs

  • Customer Satisfaction Surveys (CSAT): Measure satisfaction with product quality, pricing, availability, ordering process, customer service, etc.
  • Net Promoter Score (NPS): Tracks the likelihood of a customer recommending your products and services. Indicates customer loyalty.
  • Repeat Customers: Percentage of customers who make multiple purchases. Builds a loyal customer base and repeat sales.

Financial KPIs

  • Gross Profit Margin: Percentage of revenue remaining after direct costs of goods sold are accounted for.
  • Net Profit Margin: Percentage of revenue remaining after all expenses are accounted for. Measures overall profitability.
  • Days Sales Outstanding (DSO): Average time it takes to collect payment from customers. Lower DSO improves cash flow.
  • Cost of Goods Sold (COGS): Direct costs associated with the industrial supplies you sell (materials, manufacturing, freight). Managing COGS is key to profitability.

Product-Focused KPIs

  • Sales by Product Category: Track sales for different industrial supply categories (MRO supplies, tools, safety equipment, etc.). Helps you optimize inventory and promotions.
  • Product Margins: Analyze profit margins for different product lines.

Additional Considerations

  • E-commerce KPIs (if applicable): If you sell online, track website traffic, conversion rates, and shopping cart abandonment.
  • Technical Support: If you offer technical support or product expertise, track the number of support cases and resolution times.

Import & Export Companies

Import & Export Companies

Key Performance Indicator (KPI) for Import & Export Companies

To name a few:

Trade Volume & Value KPIs

  • Total Import/Export Value: Total dollar value of goods imported or exported in a given period.
  • Volume of Goods (Weight, Containers, Units): Tracks the quantity of goods moved, helpful for transportation and logistics management.
  • Trade Growth: Percentage change in import/export value or volume over time. Indicates whether your business is expanding or contracting.
  • Market Share: The percentage of total imports/exports within a specific market or for a particular product that your company handles.

Efficiency KPIs

  • Lead Time: Total time from when an order is placed to the final delivery to the customer (import) or buyer (export). Shorter lead times improve responsiveness.
  • Customs Clearance Time: The time it takes for shipments to pass through customs processes. Delays disrupt your supply chain.
  • Shipment Accuracy: Percentage of shipments that arrive at the correct destination with the correct contents and without damage. Impacts customer satisfaction and costs.
  • Dwell Time: The duration goods spend in a port or terminal awaiting pick-up or loading. Minimize dwell time to avoid extra charges.

Financial KPIs

  • Gross Profit Margin: Percentage of revenue remaining after direct costs of goods and freight are accounted for.
  • Net Profit Margin: Percentage of revenue remaining after all expenses are accounted for. Measures overall profitability.
  • Cost per Shipment: Average cost to import or export a single shipment, including freight, duties, and other associated costs.
  • Days Sales Outstanding (DSO): Average time it takes to collect payment from customers. Lower DSO is better for cash flow.

Customer-Focused KPIs

  • Customer Satisfaction Surveys (CSAT): Measure satisfaction with your services, pricing, communication, on-time delivery, etc.
  • Repeat Business: Percentage of customers who use your import/export services multiple times. Builds a loyal customer base.

Risk Management KPIs

  • Incoterms Compliance: Track instances of non-compliance with agreed-upon Incoterms (International Commercial Terms) which define responsibilities for risks and costs.
  • Foreign Exchange (FX) Fluctuations: If you trade in multiple currencies, track the impact of FX rate changes on your margins.
  • Country-Specific Risks: If you specialize in specific countries, monitor political or economic events that could disrupt your supply chain.

Additional Considerations

  • Product-Specific KPIs: Analyze volume, profitability, and lead times for your key product categories or top-traded goods.
  • Supplier/Buyer KPIs: Track on-time performance and reliability of your key suppliers or overseas buyers.

Heating & Cooling Services

Heating & Cooling Services

Key Performance Indicator (KPI) for Heating & Cooling Services

To name a few:

Specific focus (residential, commercial, installation, maintenance) affects priorities, choose the KPIs most relevant to your business model.

Service & Operational KPIs

  • Service Calls Completed: Number of service calls successfully completed in a given period. Primary metric of workload.
  • First-Time Fix Rate: Percentage of service calls resolved on the first visit without the need for follow-ups. High rate indicates strong technicians and good parts availability.
  • Response Time: Average time it takes to dispatch a technician after receiving a customer’s service request (especially critical for emergency calls).
  • Customer Wait Time: Average time from when a customer books an appointment to when a technician arrives. Shorter wait times enhance satisfaction.
  • Technician Utilization Rate: Percentage of working time technicians spend on billable service calls vs. travel, admin, etc. Higher utilization boosts revenue potential.

Customer-Focused KPIs

  • Customer Satisfaction Surveys (CSAT): Measure satisfaction with service quality, technician professionalism, pricing, communication, etc.
  • Net Promoter Score (NPS): Tracks the likelihood of a customer recommending your HVAC services. High NPS reflects satisfied customers.
  • Repeat Business: Percentage of customers who use your services multiple times. Builds a loyal client base.
  • Online Reviews: Monitor reviews on platforms like Google, Yelp, or industry-specific sites. Understand how customers perceive your business.

Financial KPIs

  • Revenue Growth: Percentage change in revenue over time. Are you growing your business?
  • Gross Profit Margin: Percentage of revenue remaining after direct costs of service (labor, materials) are accounted for.
  • Net Profit Margin: Percentage of revenue remaining after all expenses are accounted for. Measures overall profitability.
  • Average Contract Value (ACV): Average revenue per service contract (installation or maintenance agreements).
  • Customer Acquisition Cost (CAC): Cost of acquiring a new customer. Helps manage marketing spend and profitability.

Sales-Focused KPIs

  • New Maintenance Agreements: Track the number of new maintenance contracts sold, providing a recurring revenue stream
  • Installation Sales: If you offer new HVAC system installations, track sales volume and revenue.
  • Lead Conversion Rate: Percentage of inquiries or leads that turn into paying customers. Tracks sales process effectiveness.

Additional Considerations

  • Equipment Reliability: Track the frequency of breakdowns for the brands of HVAC equipment you install or service. Helps you choose reliable brands.
  • Seasonality KPIs: Analyze how service calls, installations, and revenue fluctuate throughout the year due to weather patterns. Plan accordingly!

Car Service

Car Service

Key Performance Indicator (KPI) for Car Service

To name a few:

Operational KPIs

  • Average Repair Order (ARO): Average revenue generated per repair ticket or vehicle serviced. Increasing ARO drives revenue.
  • Cars Serviced Per Day/Week: Tracks the volume of vehicles you service. Impacts potential revenue and helps with staffing decisions.
  • Bay Utilization (for repair shops): Percentage of time your service bays are in use. Maximize bay time for efficiency.
  • Technician Efficiency: Measure billed hours vs. hours worked by technicians. High efficiency means greater revenue potential.
  • Cycle Time: Average time from when a car arrives for service to completion. Customers value faster turnaround.

Customer-Focused KPIs

  • Customer Satisfaction Surveys (CSAT): Gauge satisfaction with service quality, price, communication, and overall experience.
  • Net Promoter Score (NPS): Tracks the likelihood of a customer recommending your service. High NPS reflects loyalty and word-of-mouth.
  • Repeat Business: Percentage of customers who return for subsequent service or maintenance. Builds loyalty.
  • Online Reviews: Monitor customer feedback on platforms like Google, Yelp, or industry-specific sites. Actively address issues.

Financial KPIs

  • Revenue Growth: Are your sales expanding or contracting? Track the health of your business.
  • Gross Profit Margin: Percentage of revenue remaining after direct costs of service (labor, parts, etc.) are accounted for.
  • Net Profit Margin: Percentage of revenue remaining after all expenses are accounted for. Measures overall profitability.
  • Labor Cost Percentage: Percentage of revenue spent on technician and staff wages. Managing labor costs is vital.
  • Parts Inventory Turnover: How frequently you sell and replace your parts inventory. Healthy turnover improves cash flow

Service-Specific KPIs

  • Oil Changes per Day/Week: If you offer this frequent service, track its volume to understand workload and customer demand.
  • Upsell Success Rate: Track percentage of customers opting for additional services beyond their original request.
  • Detailing Package Sales: If you offer car detailing, analyze sales by package type and add-on services.

Additional Considerations

  • Customer Acquisition Cost (CAC): Tracks the cost of acquiring a new customer. Helps manage marketing and sales expenses.
  • Seasonality KPIs: Analyze how service demand and revenue fluctuate throughout the year due to weather, driving patterns, etc.