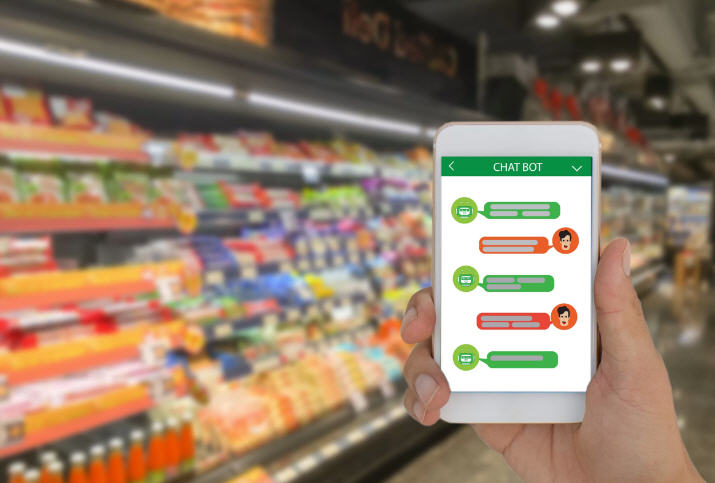
Chatbot – Retail Industry

Chatbot Retail

Generative AI has the potential to revolutionize the retail industry by powering chatbots with enhanced capabilities to engage customers, personalize experiences, and streamline operations. Here are some key ways generative AI can be leveraged in retail chatbots:

Enhanced Customer Service:

Enhanced Customer Service:

Natural Language Understanding: Generative AI-powered chatbots can understand complex customer queries and respond in a natural, conversational manner. This improves the customer experience by making interactions feel more human-like and less robotic.

Contextual Awareness:

Chatbots can maintain context throughout a conversation, remembering previous interactions and using that information to provide more relevant responses.

24/7 Support:

Chatbots can offer round-the-clock support, answering questions, resolving issues, and guiding customers through their shopping journey at any time.

24 by 7 support

Personalized Recommendations:

Product Discovery: By analyzing customer preferences and browsing history, generative AI chatbots can suggest products tailored to individual tastes and needs.

Outfit Suggestions: Chatbots can act as virtual stylists, suggesting outfits based on customer preferences, body type, and occasion.

Cross-selling and Upselling: Chatbots can recommend complementary or upgraded products based on items already in the customer’s cart or browsing history.

Content Generation:

Product Descriptions: Generative AI can create compelling and informative product descriptions that highlight key features and benefits.

Marketing Copy: Chatbots can generate catchy slogans, taglines, and social media posts to promote products and engage customers.


Personalized Emails: Chatbots can craft personalized emails for customers, such as abandoned cart reminders or recommendations based on past purchases.

content creation

Virtual Shopping Assistants:

Product Descriptions: Guided Shopping: Chatbots can act as virtual shopping assistants, guiding customers through the entire shopping process, from product discovery to checkout.

Real-time Inventory Updates: Chatbots can provide real-time information on product availability, helping customers make informed purchasing decisions.

Virtual Try-On: Generative AI can be used to create virtual try-on experiences, allowing customers to see how clothes or accessories would look on them without physically trying them on.

virtualshoppingassistant

Data Analysis and Insights:

Customer Feedback Analysis: Chatbots can analyze customer feedback and reviews to identify trends and areas for improvement.

Sales Data Analysis: Chatbots can analyze sales data to identify popular products, understand customer behavior, and optimize marketing strategies.

Example:

Imagine a customer interacting with a retail chatbot powered by generative AI. The chatbot can understand the customer’s query about finding a dress for a wedding, suggest suitable options based on their preferences and budget, and even generate outfit ideas by suggesting matching accessories. The chatbot can also answer questions about product details, availability, and shipping, providing a seamless and personalized shopping experience.

Overall, generative AI has the potential to transform retail chatbots into intelligent, conversational agents that can enhance customer engagement, drive sales, and provide valuable insights for businesses. However, it’s important to ensure that these chatbots are transparent, ethical, and prioritize customer privacy.

ONE OF MANY EXAMPLES WHERE THE RETAIL INDUSTRY CAN BENEFIT FROM CHATBOT WITH GENERATIVE AI.

Emergency Medical Service

Emergency Medical Service

Key Performance Indicator (KPI) for Emergency Medical Service

To name a few:

Since EMS systems have variations based on local regulations and service models, prioritize the KPIs most relevant to your organization.

Response Time KPIs

  • Call-to-Arrival Time: Average time it takes for EMS to arrive on scene after a 911 call is received. Shorter times are crucial for patient outcomes.
  • Response Time Compliance: Percentage of calls where EMS arrives on scene within a set target time (dependent on local standards or regulations).
  • Dispatch Time: Time from receiving a call to when an ambulance or unit is dispatched. Efficient dispatching is vital.
  • Turnaround Time: Total time from when EMS arrives on the scene to when they are ready for the next call. Impacts operational efficiency.

Patient Outcomes KPIs

  • Survival Rates: Track survival rates for critical conditions like cardiac arrest or trauma. Measures EMS effectiveness in life-saving interventions.
  • Pain Management: Measure effectiveness in assessing and managing patient pain before and during transport.
  • Clinical Protocol Adherence: Percentage of cases where EMS personnel follow established treatment protocols and guidelines.
  • Hospital Readmission Rates: Track how often patients are readmitted to the hospital shortly after EMS transport. May indicate quality of care issues.

Operational KPIs

  • Call Volume: Total number of 911 calls received and responded to during a specific period. Measures workload.
  • Unit Utilization: Percentage of time ambulance units are actively on calls vs. waiting. Helps optimize fleet size and staffing.
  • Transport Time: Average time it takes to transport a patient from the scene to the hospital.
  • Fuel Efficiency: Track fuel consumption per mile or similar metrics to help manage operating costs.
  • Medication and Supply Errors: Track any instances of medication errors or supply shortages.

Financial KPIs

  • Cost per Transport: Average cost of responding to and transporting a single patient. Helps to control costs.
  • Reimbursement Rate: Track success in obtaining reimbursement from insurance companies or patients for services rendered. Impacts revenue.
  • Percentage of Uncompensated Care: Tracks calls where EMS is unable to secure any reimbursement. Impacts financial sustainability.

Personnel KPIs

  • Employee Satisfaction: Measure job satisfaction and engagement among paramedics and EMTs. High satisfaction is linked to better patient care.
  • Training and Certification: Track compliance with continuing education and recertification requirements for EMS personnel.
  • Safety Incident Rate: Number of workplace injuries or accidents. Safety is always a priority in EMS.

Additional Considerations

  • Community Outreach: Track the effectiveness of public education initiatives on CPR, first aid, or other health topics.
  • Patient Satisfaction Surveys: Measure patient satisfaction with EMS care, transport, and overall experience.

Housing

Housing

Key Performance Indicator (KPI) for Housing

To name a few:

KPIs will vary depending on your role (property developer, rental property manager, real estate investor, etc.).

Real Estate Development KPIs

  • Construction Cost per Square Foot: Tracks the cost of building housing units. Managing this directly impacts profitability.
  • Sales Velocity: The speed at which you sell newly developed properties. Faster is typically better for cash flow and returns.
  • Time to Completion: Total time from land acquisition to finished units ready for sale or occupancy. Impacts project timing and costs.
  • Return on Investment (ROI): Profit earned on a development project as a percentage of its cost. Measures project success.
  • Pre-Sales: Percentage of units sold before construction is completed. Helps gauge market demand.

Rental Property Management KPIs

  • Occupancy Rate: Percentage of rental units currently occupied. High occupancy is key to maximizing rental income.
  • Rent Collection Rate: Percentage of rent payments received on time. Good collection rates are essential for cash flow.
  • Average Rent per Unit: Average rent charged across your rental portfolio. Helps track and adjust pricing over time.
  • Tenant Turnover Rate: Percentage of tenants who move out within a given period. Lower turnover means less expense in preparing units and finding new tenants.
  • Maintenance Costs: Track spending on repairs, upkeep, and general maintenance of rental properties.

Real Estate Investment KPIs

  • Net Operating Income (NOI): Total rental income minus operating expenses. Key measure of profitability before debt and taxes.
  • Capitalization Rate (Cap Rate): NOI divided by the property’s current market value. Key metric for real estate investors.
  • Cash-on-Cash Return: Annual pre-tax cash flow of a property divided by the total cash invested. Shows immediate returns.
  • Vacancy Rate: Percentage of time a rental property is unoccupied. Minimizing vacancy periods is key to maximizing income.
  • Appreciation: Increase in property value over time. A major component of long-term real estate investment returns.

Market-Focused KPIs

  • Housing Affordability Index: Measures the ratio of median home prices to median income in a given area. Tracks whether housing costs are attainable for residents.
  • Days on Market (DOM): Average number of days a property is listed for sale before it receives an accepted offer.
  • Housing Starts: Tracks the number of new residential construction projects initiated. An indicator of housing supply.
  • Interest Rates: Track prevailing mortgage interest rates that affect buyer affordability and overall market demand.

Additional Considerations

  • Tenant Satisfaction (for rental properties): Measure satisfaction with unit quality, service, amenities, etc.
  • Neighborhood-Specific KPIs: Analyze crime rates, school quality, or other factors that impact desirability and value in a neighborhood.

Theater & Opera

Theater & Opera

Key Performance Indicator (KPI) for Theater & Opera

To name a few:

Since different theaters or opera houses may prioritize varying goals, choose the KPIs most aligned with your mission.

Audience Development KPIs

  • Ticket Sales: Total number of tickets sold for performances. Primary measure of audience size and revenue potential.
  • Attendance Rate: Percentage of available seats that are actually filled. Tracks how well you’re maximizing your audience.
  • Subscription Sales: Number of subscriptions sold for a season, providing predictable revenue and a loyal audience base.
  • Audience Demographics: Tracking the age, income, and other characteristics of your audience helps you tailor programming and outreach.
  • New vs. Returning Patrons: Understanding this ratio helps assess your ability to attract and retain an audience.

Financial KPIs

  • Revenue Growth: Percentage change in revenue over time. Are your ticket sales and other revenue sources expanding?
  • Revenue per Seat: Average revenue generated per seat for a performance. Helps understand pricing efficiency.
  • Contributed Income: Amount of donations, grants, and sponsorships secured. Vital for non-profit theaters.
  • Production Costs: Track the expenses associated with staging productions, including sets, costumes, artist fees, etc. Managing costs is key to financial health.
  • Profit Margin (if applicable): Percentage of revenue remaining after all expenses are accounted for. Measures overall financial health.

Artistic & Engagement KPIs

  • Critical Reviews: Track the reviews from professional critics in newspapers, magazines, or online platforms. Positive reviews drive interest.
  • Audience Feedback Surveys: Measure audience satisfaction with the production quality, performances, venue experience, etc.
  • Community Engagement: If relevant, track participation in outreach programs, educational initiatives, or community events.
  • Diversity & Inclusion: Measure the diversity of your productions, cast, staff, and audience to track any DEI initiatives.

Operational KPIs

  • Seat Occupancy Rate: Percentage of available seats filled for a production run. Maximizing occupancy increases revenue potential.
  • Advance Sales: Percentage of tickets sold before the performance date. Helps gauge demand and manage pricing.
  • On-Site Revenue: Track revenue from concessions, merchandise, and other ancillary sales.
  • Volunteer Engagement: If relevant, track the number of volunteer hours and the value of their contributions.

Additional Considerations

  • Social Media Engagement: Track likes, shares, comments for your theater or specific productions.
  • Awards and Recognition: Awards can boost prestige and help attract audiences or donors.

Utility Company

Utility Company

Key Performance Indicator (KPI) for Utility Company

To name a few:

The most relevant KPIs will vary slightly depending on whether you focus on electricity, gas, water, or a combination of services.

Reliability & Safety KPIs

  • SAIDI (System Average Interruption Duration Index): Measures average outage duration per customer. Lower SAIDI means better reliability.
  • SAIFI (System Average Interruption Frequency Index): Average number of interruptions a customer experiences. Lower is better.
  • CAIDI (Customer Average Interruption Duration Index): Average length of an outage for customers who actually experience one (SAIDI/SAIFI).
  • Safety Incident Rate: Number of workplace injuries or accidents. Safety is always a top priority.
  • OSHA Recordable Incident Rate: Number of OSHA-recordable injuries or illnesses per 200,000 hours. Tracks serious incidents.

Operational Efficiency KPIs

  • Line Losses: Percentage of energy lost during transmission and distribution due to technical factors. Minimizing losses improves efficiency.
  • Unaccounted for Water/Gas: Percentage of water or gas that is produced but not billed due to leaks, theft, or meter inaccuracies.
  • Workforce Productivity: Track work orders completed per employee or other output metrics relevant to your utility.
  • Asset Utilization: How efficiently your infrastructure (power plants, pipelines, treatment facilities) is being used.
  • Maintenance Costs: Track spending on upkeep, repair, and preventative maintenance of your utility infrastructure.

Customer-Focused KPIs

  • Customer Satisfaction Surveys (CSAT): Measure satisfaction with service reliability, pricing, billing, customer service interactions, etc.
  • Bill Payment Timeliness: Track percentage of bills paid on time. Late payments impact cash flow.
  • New Customer Connections: Measures growth in your customer base.
  • Call Center Metrics: Average wait times, call resolution rates, etc., for your customer service call centers.

Financial KPIs

  • Earnings Per Share (EPS): Indicates profitability for investors in public utilities.
  • Return on Equity (ROE): Net income divided by shareholder equity. A vital measure of profitability for investors.
  • Debt-to-Equity Ratio: Measures financial leverage, important as utilities often have high capital expenditures.
  • Operating Expense Ratio: Operating expenses as a percentage of revenue. Helps control costs and maximize profitability.
  • Revenue per Customer: Average revenue generated per customer, useful for tracking across different customer segments.

Environmental KPIs

  • Carbon Emissions: Measure emissions (often in tons of CO2 equivalent) from your utility operations, especially important for power generation.
  • Renewable Energy Portfolio: Percentage of energy generated or sourced from renewable sources. Important for energy transition.
  • Water Conservation: Track any initiatives or results in reducing water usage or promoting water conservation among customers.

Service Sector

Service Sector

Key Performance Indicator (KPI) for Service Sector

To name a few:

Since this sector is so broad, the most relevant KPIs will vary depending on the specific type of service you provide (consulting, healthcare, IT support, hospitality, etc.).

Customer-focused KPIs

  • Customer Satisfaction Surveys (CSAT): Measure satisfaction with service quality, response times, overall experience, etc. High satisfaction is crucial to service businesses.
  • Net Promoter Score (NPS): Measures the likelihood of a customer recommending your service. High NPS reflects loyalty.
  • Repeat Business: Percentage of business coming from existing customers. Builds a loyal client base and repeat revenue.
  • Customer Churn Rate: Percentage of clients who stop using your services. Minimize churn rate for greater stability.
  • Customer Lifetime Value (CLV): Projected total revenue a customer generates over their relationship with your service business. Helps guide customer acquisition efforts.

Service Delivery KPIs

  • Response Time: Average time it takes to respond to a customer inquiry or request. Fast response enhances customer satisfaction.
  • First Contact Resolution Rate: Percentage of customer issues resolved on the first contact, without needing follow-ups. Improves efficiency and customer satisfaction.
  • Resolution Time: Average time it takes to fully resolve a customer issue or complete a service request.
  • Service Backlog: The amount of outstanding work waiting to be completed. Managing backlog is key to avoiding delays.
  • Client/Project Profitability: Analyze the profitability of different clients, projects, or service offerings.

Financial KPIs

  • Revenue Growth: Percentage change in revenue over time. Are you growing your business?
  • Profit Margin: Percentage of revenue remaining after all expenses are accounted for. Measures overall profitability.
  • Billable Utilization Rate: Percentage of employee time spent on work that can be billed to clients vs. non-billable tasks. Higher utilization increases revenue potential.
  • Revenue per Employee: Measures revenue generated per employee, can be used to assess efficiency.
  • Cost of Service Delivery: The direct costs involved in providing your services (labor, materials, etc.). Managing these costs impacts your margins.

Operational KPIs

  • Employee Satisfaction: Track employee morale and engagement. A happy, motivated team often translates to better client service.
  • Knowledge Management: If applicable, measure the effectiveness of your systems for capturing and sharing knowledge within your team.
  • Project Completion Rate: Percentage of projects completed on time and on budget in service businesses where projects are the norm.

Industry-Specific KPIs

  • Hospitality: KPIs like occupancy rate (hotels), average revenue per available room (RevPAR), or customer ratings are very hospitality-specific.
  • Consulting: Track project success rates, billable hours, and client acquisition metrics as specific examples.
  • Healthcare: KPIs like patient wait times, readmission rates, and patient satisfaction become vital.

Warehouse

Warehouse

Key Performance Indicator (KPI) for Warehouse

To name a few:

The best set of KPIs depends on your specific role (warehouse manager, part of a logistics network, etc.).

Operational Efficiency KPIs

  • Throughput: The volume of goods (units, pallets, containers) moved through the warehouse in a given period. Helps track workload.
  • Order Picking Accuracy: Percentage of orders picked and shipped without errors. High accuracy is essential to avoid costly returns or reshipments.
  • Putaway Time: Time taken to receive and store incoming goods in their designated locations. Faster putaway times improve efficiency.
  • Receiving and Shipping Accuracy: Percentage of shipments received or dispatched without errors compared to documentation.
  • Cycle Time: Total time it takes from the moment a customer order is received to when it is shipped out. Shorter cycle times improve responsiveness.
  • Dock-to-Stock Time: Time from when goods arrive on the dock to when they are put away in storage locations.

Inventory Management KPIs

  • Inventory Accuracy: How closely your inventory records match the actual physical inventory on hand. High accuracy is crucial.
  • Inventory Turnover Ratio: How frequently inventory is sold and replenished over a time period. High turnover often indicates healthy demand and efficient management.
  • Days Inventory Outstanding (DIO): Average number of days inventory is held before being sold or used. Shorter DIO indicates better cash flow.
  • Carrying Costs: The costs of storing inventory, including rent, utilities, insurance, and obsolescence. Managing carrying costs is vital to profitability.
  • Backorders: Instances where orders cannot be fulfilled due to lack of inventory. Lost sales and frustrated customers.

Resource Utilization KPIs

  • Labor Productivity: Measure output (orders shipped, etc.) per labor hour worked. Helps optimize staffing levels.
  • Warehouse Space Utilization: Percentage of your warehouse space that is actively being used for storage. Maximizing utilization improves efficiency.
  • Equipment Utilization: Track uptime and usage rates for forklifts, conveyors, and other warehouse equipment.

Safety and Cost KPIs

  • Safety Incident Rate: Number of workplace injuries or accidents per 200,000 labor hours worked (industry-standard calculation). Lower is better, safety is paramount.
  • Cost per Order: Average cost to process and ship a single order. Helps manage fulfillment costs.
  • Damage Rate: Percentage of goods damaged during handling or storage within the warehouse. Impacts costs.

Additional Considerations

  • Perfect Order Rate: Measures the percentage of orders fulfilled without errors, damage, or delays. A comprehensive measure of quality.
  • On-Time Shipping: Percentage of orders shipped out on or before the promised delivery date. Crucial for customer satisfaction

Self Storage

Self Storage

Key Performance Indicator (KPI) for Self Storage

To name a few:

Choose the ones most relevant to whether you’re an owner/operator of a facility or primarily focused on real estate investment in this sector.

Occupancy KPIs

  • Occupancy Rate: Percentage of available storage units currently rented out. Key metric for tracking how full your facility is.
  • Economic Occupancy: Measures your actual collected rental income as a percentage of your potential gross income if fully occupied. Accounts for discounts and vacancies.
  • Average Length of Stay (ALOS): Average duration a customer rents a storage unit. Longer ALOS increases revenue stability.
  • Move-Ins and Move-Outs: Track the number of customers moving into and out of your facility during a given period. Helps understand tenant churn.

Revenue & Pricing KPIs

  • Revenue per Available Unit (RevPAU): Total rental revenue divided by the number of available units. Helps track revenue optimization.
  • Revenue per Occupied Unit: Average revenue generated per occupied storage unit.
  • Average Rental Rate: Average price charged per storage unit. Analyze this by unit size and features.
  • Price Changes: Track how often you adjust rental rates and the impact of those changes on occupancy and revenue.

Financial KPIs

  • Net Operating Income (NOI): Total revenue minus operating expenses. Key measure of profitability before debt and taxes.
  • Gross Profit Margin: Percentage of revenue remaining after direct operating expenses (property taxes, utilities, labor, etc.).
  • Cap Rate (Capitalization Rate): NOI divided by current market value of the property. Key metric for real estate investors.
  • Cost per Square Foot: Tracks your operating costs relative to the size of your facility.

Customer-Focused KPIs

  • Customer Satisfaction Surveys (CSAT): Measure satisfaction with the rental process, facility cleanliness, security, pricing, etc.
  • Online Reviews: Monitor reviews on platforms like Google and industry-specific sites. Gauge customer sentiment.
  • Referral Rate: Percentage of new customers who came via referrals from existing customers.

Operational KPIs

  • Delinquency Rate: Percentage of tenants who are late on rent payments. Lower is better for cash flow.
  • Maintenance Costs: Track spending on repairs, upkeep, and cleaning of the self-storage facility.
  • Website Traffic: If you offer online reservations, track the number of visits to your website.
  • Facility Security: Track incidents of theft or vandalism to assess your security measures.

Retail Store and Super Market

Retail Store and Super Market

Key Performance Indicator (KPI) for Retail Store and Super Market

To name a few:

Sales and Revenue KPIs

  • Total Sales (Revenue): Total sales generated in a specific period (daily, weekly, etc.). This is your top-line sales metric.
  • Sales Growth: Increase or decrease in sales compared to previous periods. Tracks overall business performance.
  • Average Transaction Value (ATV): Average amount spent per customer transaction. Increasing ATV drives more revenue.
  • Sales per Square Foot: Revenue generated per square foot of retail space. Helps assess sales floor efficiency.
  • Sales by Product Category: Track sales for different categories (produce, groceries, household, etc.). Helps optimize inventory and promotions.

Customer-Focused KPIs

  • Foot Traffic: Number of customers entering the store. Shows the potential customer reach.
  • Conversion Rate: Percentage of visitors who make a purchase. Higher conversion means better sales techniques and product selection.
  • Customer Satisfaction Surveys (CSAT): Measure satisfaction with store layout, product variety, prices, staff service, checkout experience, etc.
  • Net Promoter Score (NPS): Tracks the likelihood of a customer recommending your store. Indicates customer loyalty.
  • Repeat Customers: Percentage of customers who return for subsequent purchases. Builds a loyal customer base and repeat sales.

Inventory KPIs

  • Inventory Turnover Ratio: How frequently inventory is sold and replenished. High turnover often indicates healthy demand and efficient management.
  • Sell-Through Rate: Percentage of inventory sold within a specific period. Helps identify slow-moving vs. fast-moving items.
  • Shrinkage: Loss of inventory due to theft, damage, or errors. A low shrinkage rate is desirable.
  • Days Inventory Outstanding (DIO): Average number of days inventory is held before being sold. Shorter DIO indicates better cash flow.
  • Stockouts: When a customer wants to buy an item but it’s out of stock. This leads to lost sales and frustration.

Financial KPIs

  • Gross Profit Margin: Percentage of revenue remaining after the direct cost of goods sold (COGS) is accounted for.
  • Net Profit Margin: Percentage of revenue remaining after all expenses are accounted for. Measures overall profitability.
  • Operating Expenses as a Percentage of Sales: Helps control costs and maximize profitability.

Operational KPIs

  • Basket Size: Average number of items purchased per customer transaction.
  • Checkout Wait Time: Average time customers spend waiting in line. Minimizing wait times improves the customer experience.
  • Staff Productivity: Track sales per employee or labor hours per transaction to help optimize staffing levels and scheduling.

Additional Considerations

  • Promotional Effectiveness: Analyze sales lift from promotions and discounts. Helps optimize your marketing efforts.
  • Seasonality: Track how sales fluctuate throughout the year due to holidays, events, or seasonal goods. Plan accordingly!

Pest Control

Pest Control

Key Performance Indicator (KPI) for Pest Control

To name a few:

Business model with KPI’s (residential, commercial, type of pests targeted) can affect priorities, select the KPIs most relevant to you.

Service Delivery KPIs

  • Customer Retention Rate: Percentage of customers who renew their pest control contracts annually. High retention means satisfied customers.
  • Response Time: Average time it takes to respond to a customer’s request for service, especially for urgent issues. Faster response improves customer satisfaction.
  • Treatment Effectiveness: Measure the success rate of your treatments in eliminating or reducing pest infestations.
  • CallBack Rate: Percentage of jobs requiring a follow-up visit due to unresolved pest issues. Lower callback rate indicates better initial treatment effectiveness.
  • Technician Efficiency: Track the number of service calls a technician can complete in a given workday. Higher efficiency boosts revenue potential.

Customer-Focused KPIs

  • Customer Satisfaction Surveys (CSAT): Measure satisfaction with service quality, technician professionalism, pricing, communication, etc.
  • Net Promoter Score (NPS): Tracks the likelihood of a customer recommending your pest control services. High NPS reflects loyal customers.
  • Online Reviews: Monitor reviews on platforms like Google, Yelp, or industry-specific sites. Understand how customers perceive your business.
  • Referral Rate: Percentage of customers who came via referrals from existing customers. Strong referrals are a sign of good service.

Sales & Revenue KPIs

  • Revenue Growth: Are your sales expanding or contracting over time? Track the health of your business.
  • Average Contract Value: Average revenue for a pest control service contract. Helps understand service pricing.
  • Customer Acquisition Cost (CAC): Cost of acquiring a new customer. Helps manage marketing spend and profitability.
  • Sales Conversion Rate: Percentage of leads or quotes that turn into paying customers. Tracks sales process effectiveness.

Financial KPIs

  • Gross Profit Margin: Percentage of revenue remaining after direct costs of service (technician labor, chemicals, etc.) are accounted for.
  • Net Profit Margin: Percentage of revenue remaining after all expenses are accounted for. Measures overall profitability.
  • Renewal Rate: Percentage of annual service contracts that customers renew, providing a stable revenue source.

Operational KPIs

  • Chemical Usage & Costs: Track the type and volume of chemicals used and their associated costs. Manage these for profitability.
  • Fleet Management: If you operate vehicles, track fuel efficiency, maintenance costs, and vehicle utilization to optimize expenses.